SSE DevTools Panel
Inspect SSE, NDJSON, and Connect+JSON streams inside Chrome DevTools.
About
SSE DevTools Panel is a Chrome DevTools panel for debugging streaming responses in Chromium browsers. It helps you inspect SSE, EventSource, NDJSON, and Connect+JSON traffic without forcing you to rewrite the page, so you can analyze long-lived fetch-based streams, chat payloads, and other incremental responses in a dedicated workbench.
What is SSE DevTools Panel
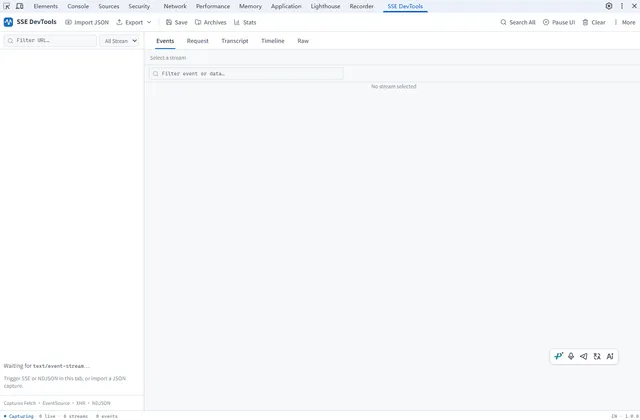
SSE DevTools Panel is a Chrome extension that adds a dedicated DevTools panel for streaming response debugging. It focuses on data that arrives in pieces rather than all at once, including SSE, EventSource, NDJSON, and Connect+JSON.
It is built for Chromium-based browsers and is meant to complement the standard Network panel, which already handles basic SSE but can be awkward for AI-style and product-style streams built on fetch or custom protocols. Instead of forcing you to read raw frames, the extension organizes the stream into views that are easier to inspect.
The listing on the Chrome Web Store shows a 5.0 rating from 1 review and 76 users. The extension is offered by ot.lzq163 and the store page lists version 1.1.3, updated August 24, 2026.
Key features
This streaming response debugger includes several views and filters that are aimed at practical inspection rather than simple packet capture.
- Capture streams from fetch, EventSource, and XHR without changing how the page behaves.
- Browse a streams sidebar with URL search and transport filters.
- Inspect an events table with a JSON tree, text and regex filtering, and resizable columns.
- Open a request view that shows headers and body, with sensitive headers redacted.
- Use a conversation view that merges fragments into Content, Thinking, Tools, and Meta channels.
- Review a timeline with arrival timing, stall highlights at 250 ms or more, gap distribution, and reconnect markers.
- Copy the raw text view with one click.
- Check stats, anomaly detection, spec checks, and Search All across streams.
- Import and export data as JSON, CSV, or .sse, and keep local archives.
These features make it useful as a browser-based stream inspector for debugging incremental payloads, not just a general HTTP viewer.
How to use it
Using the panel is straightforward once the extension is installed.
- Install the extension from the Chrome Web Store.
- Open the page you want to debug, then press F12 to open DevTools.
- Select the SSE DevTools Panel tab.
- Refresh the page and trigger the streaming request you want to inspect.
- Choose a stream from the sidebar.
- Move between Events, Request, Conversation, Timeline, or Raw to study different parts of the response.
The workflow matters because the panel captures activity as it happens. If you open DevTools after the stream has already completed, you may miss the parts you want to analyze.
Who it is for
This Chrome DevTools panel is aimed at developers who work with long-lived or incremental responses.
It is a good fit for:
- engineers building AI chat interfaces
- developers debugging notification feeds or progress updates
- teams working with streaming APIs in Chromium browsers
- product engineers trying to understand chunked or framed responses
- anyone comparing transport behavior across fetch, EventSource, and XHR
The extension is especially relevant when payloads contain mixed content that is hard to read in raw form, such as chat messages, tool outputs, search sources, or reasoning-related fragments.
What to know before you use it
There are a few important limits to keep in mind before relying on this streaming response panel.
- It is Chromium-only at the moment; the store notes that there is no Firefox or Safari panel yet.
- It does not capture requests that begin inside a page Service Worker.
- Conversation reconstruction depends on the site’s protocol, so the view may need updates if a vendor changes its stream format.
- The extension is designed for debugging and inspection, not for replacing an official backend log or server-side trace.
- If you need authoritative request history, server metrics, or exact transport behavior outside the browser, use the backend, gateway, or vendor tools as the source of truth.
The developer says it does not collect or use your data and lists privacy handling as not being sold, not being transferred for unrelated uses, and not being used for creditworthiness. For security-sensitive work, still verify what is present in the page and what is redacted before sharing screenshots or exports.
If your team needs a browser-based way to inspect SSE streams, NDJSON payloads, or Connect+JSON responses, SSE DevTools Panel offers a focused workflow inside DevTools instead of a generic network capture view.
FAQ
Is SSE DevTools Panel free?
Yes, the Chrome Web Store listing does not show a price, and the extension appears to be free to add from the store. The page shows 76 users and a 5.0 rating from 1 review.
Which browsers does it support?
It supports Chromium-based browsers through a DevTools panel. The listing specifically says there is no Firefox or Safari panel yet.
Which browsers does SSE DevTools Panel support?
It supports Chromium browsers, including Chrome and Edge-style workflows. The listing says there is no Firefox or Safari panel yet.
Which browsers can use this DevTools panel?
It is built for Chromium browsers such as Chrome and Edge. The listing specifically says there is no Firefox or Safari panel yet.
Which browsers does it work with?
It is designed for Chromium browsers, including Chrome and Edge. The listing does not mention Firefox or Safari support.
What kinds of streams can it inspect?
It can inspect SSE, EventSource, NDJSON, and Connect+JSON streams. It also captures data from fetch and XHR.
What streaming formats does it inspect?
It is designed for SSE, EventSource, NDJSON, and Connect+JSON streams. The panel also captures streams initiated with fetch and XHR.
Can it inspect fetch-based streaming responses?
Yes, it can capture streams from fetch, EventSource, and XHR. That makes it useful when an app uses custom streaming protocols instead of plain SSE.
Can it inspect fetch-based streams, or only EventSource?
It can inspect fetch-based streams as well as EventSource and XHR. The feature list explicitly says it captures streams from all three without changing page behavior.
What streaming formats can it inspect?
It can inspect SSE, EventSource, NDJSON, and Connect+JSON streams. It also mentions capture support for fetch and XHR traffic when those requests carry streaming responses.
Can it capture everything a page sends?
No, it cannot capture requests started inside a page Service Worker. For those cases, you will need other network or server-side logging tools.
Can it show reconstructed AI chat messages?
Yes, it can merge fragments into a conversation view with Content, Thinking, Tools, and Meta channels. That depends on the site’s stream protocol and may need updates if the format changes.
Can it show AI chat fragments as readable sections?
Yes, when the site protocol supports it. The Conversation view can merge fragments into Content, Thinking, Tools, and Meta channels, but the result depends on the upstream format.
Does it work with Service Worker requests?
No, the listing says it does not capture requests started inside a page Service Worker. For those cases, you will need another debugging approach or direct server logs.
What export formats are available?
It supports JSON, CSV, and .sse exports, plus local archives. That makes it easier to share a capture or keep a record of a stream session.
Can it show a stream as a readable conversation?
Yes, it includes a conversation view that merges fragments into Content, Thinking, Tools, and Meta channels. That reconstruction depends on the site’s protocol and may need updates if a provider changes its format.
Who should use this extension?
It is best for developers debugging AI chat UIs, notification streams, progress updates, and other long-lived streaming APIs. If you only need basic network inspection, Chrome’s built-in tools may be enough.
Does it work with Service Workers?
No, it does not capture requests started inside a page Service Worker. If your app routes streaming traffic through a worker, you will need another debugging path as well.
Does it replace backend logs or server tracing?
No, it only shows browser-visible traffic. For authoritative server logs, service worker paths, or infrastructure-level debugging, you should use the official backend source instead.
Who is this extension best for?
It is best for developers building AI chat UIs, notification feeds, progress indicators, and other long-lived streaming interfaces. It is especially helpful when you need to inspect timing, reconnects, or fragmented payloads.
Who is this tool best for?
It is best for developers debugging AI chat UIs, notification feeds, progress streams, and other long-lived streaming APIs. The conversation and timeline views are especially useful for those workflows.
Does it replace server logs or official monitoring tools?
No, it is a browser-side debugging tool, not a backend observability system. Use official server logs or vendor tools when you need authoritative records, exact server timing, or traces beyond the browser.